Martin Dubois, ir, master in environment, quotes Machiavelli: “He who controls the Fear of people becomes the master of their souls” CO2 has been declared the culprit of many climatic ills. But is it really?
In this article, we will summarize various studies and attempt to provide a scientific answer to the debate, without bias (the author has no conflicts of interest in either direction). First, we'll look at the famous consensus of over 99% of scientists, discuss the “urban island” effect on temperature sensors, and then look at temperature and CO2 variations over the last 150,000 years, which can tell us a lot; Milankovitch cycles, the causes of these variations, the solubility of CO2 in the oceans, and finally we'll look at the CO2 molecule and the quantification of its ability to capture IR rays, to finally look at a series of studies proposing an alternative explanation, a direction ignored by the IPCC. Finally, let's tackle the legal decision concerning the scientific errors in Al Gore's film “An Inconvenient Truth”. If CO2 is not the cause of current global warming, Europe's actions, which are having disastrous economic consequences, should be reviewed. This scientific tour does not pretend to hold THE truth, but at least to look with open eyes in several directions.
“More than 99% of scientists agree that global warming is caused by man”. Really ?
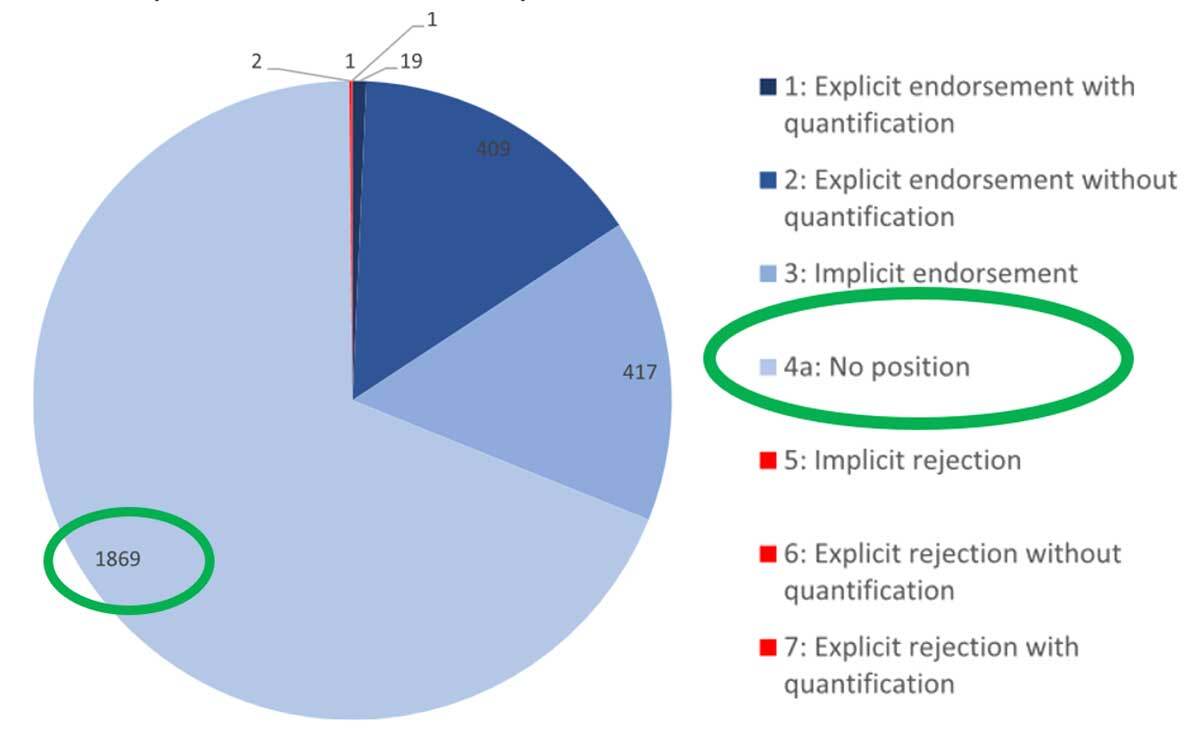
Figure 1 Ratings and categorizations given to 2718 randomly-sampled climate abstracts.
The article by Lynas1 which asserts this is flawed in four respects, as Dentelski & alii2 point out:
- The position of the 2718 studies (for or against the human origin of global warming) is observed only in the “abstract” of the article, i.e. its summary. And without being clearly defined (100%, 50%, 20% caused?).
- Of the 2718 studies, 1869 take no position, i.e. 68% of the studies. Lynas considered that if you don't give your opinion (in the abstract), you agree (fig. 1). This is a rather unconvincing mode of proof.
- Dentelski et alii carried out a test: they used 50 climate studies written by people who were clearly sceptical about the human origin of global warming. Applying the procedure of analyzing only the abstract, they found that 54% of these studies are classified 3 and 4a, and therefore if we follow the Lynas method, 54% of these studies support the human origin of warming!
- The “Mellow Abstract Bias ». Moved by the fear of seeing his article rejected, an author in his abstract will come out with watered-down conclusions to avoid rejection. Among the 1968 papers with no position, 18 concerned the urban island problem (weather station sensors in cities see their temperature rise over time as a result of urban growth). In their paper, Willie Soon & alii,3 show a difference between a mix of temperature sensors (urban and non-urban) which estimate the temperature rise at 0.85°C/century over the period 1850-2018, whereas it is only 0.55°/century for non-urban temperature sensors (figure 2). This difference of 0.30°C is significant and seems not to be taken into account by the IPCC. So these 18 articles translate as follows: 1 rated 2 (explicit support), 4 rated 3 (implicit support), and 13 rated 4 should they all join the sceptics’ clan?
- Another interesting point cited by R. Lindzen is that scientists have to keep quiet (if they're sceptical), otherwise they lose their funding4.
In conclusion, it would be an exaggeration to consider that all 68% of “no position” people agree with the ill-defined thesis of Lynas' article. Nor, of course, can we assume that all 68% are against, which would give a 32% consensus, so Lynas' conclusion of over 99% is not based on sound scientific analysis.
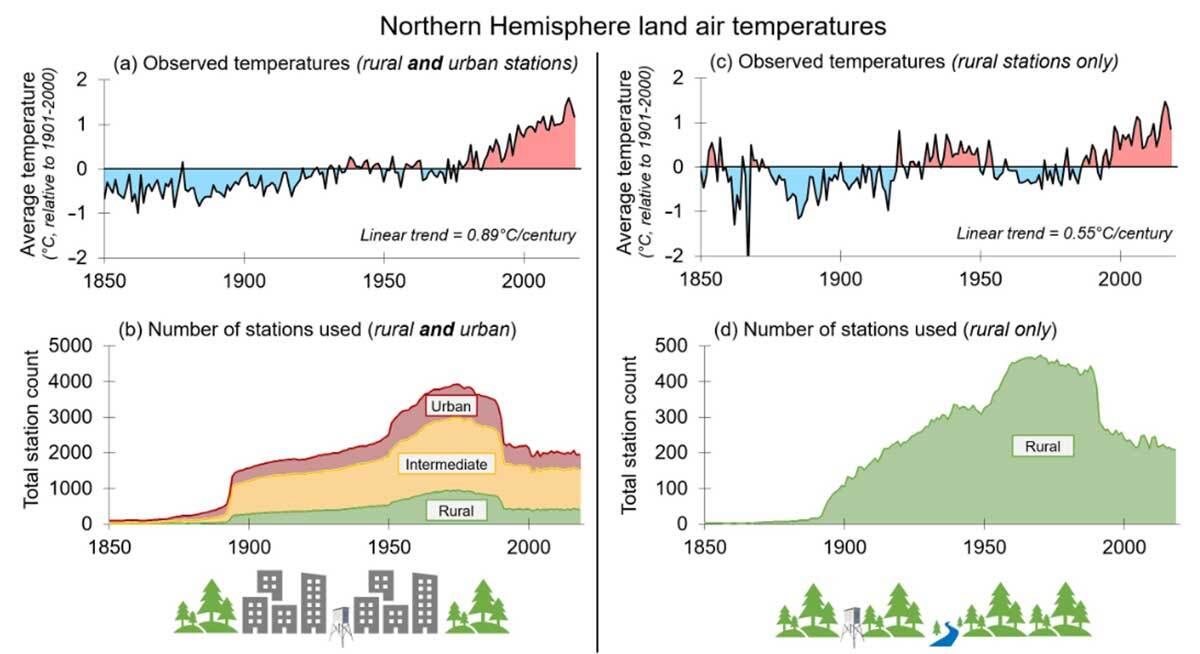
Figure 2: visual comparison of the two different estimates of Northern Hemisphere land air temperature trends (1850-2018) considered in this article. Both series were generated using version 3 of NOAA NCEI’s Global Historical Climatology Network dataset.
Temperature and CO2 trends over the last 150,000 years; our interglacial period (from -12,000 years ago to the present day) is strewn with climatic optimums
There was the climatic optimum of the Bronze Age, the Roman climatic optimum from 200 AD to 200 CE, (during which Hannibal's elephants crossed the Alps), and the medieval optimum from the 10th to the 13th century (during which the glaciers of the Alps reached a minimum, and vines grew north of London). This was followed by the Little Ice Age from the 14th to the 19th century, during which Alpine glacier volumes increased until 1850. In 1850, they began to melt. No fuel was burned at the time5.
In the graph below6 , if we look back to the last interglacial period around 120,000 years ago, it was about 2 degrees warmer than today. This was calculated by measuring isotopes in glacier boreholes in Antarctica (Vostok). And our ancestors certainly didn't burn fuel back then... So is CO2 concentration the only driving force behind the Earth's temperature today? Another observation from the graph: at -120,000 years ago, first the temperature drops, then 8,000 years later, CO2 (black arrow). Temperature controls CO2, not the other way round. Henry's Law explains why. Temperature, on the other hand, changes through orbital forcing. These are the Milankovitch cycles, see below.
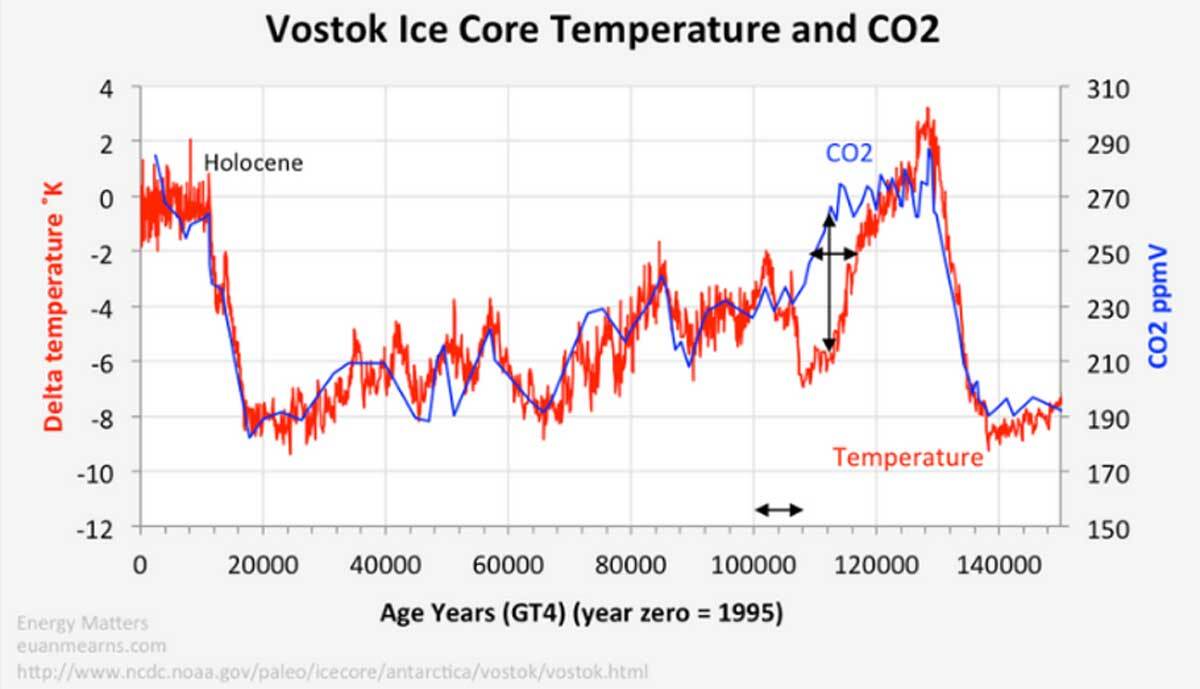
Figure 3: At glacial terminations, CO2 and temperature are closely aligned because warming triggered by orbital forcing (Milankovitch) leads to a rise in green house gasses. When the same orbital forcing takes earth back to glacial conditions CO2 lags by several thousand years (8 000 years on this chart) as indicated by the arrows. Temperature falls dramatically even with high CO2. Cold conditions eventually lead to CO2 being pumped down. Temperature controls CO2 and not vice versa.
Henry's Law: colder water dissolves more gases
This variation in atmospheric CO2 is mainly due to one of the consequences of Henry's Law: when water temperature is lower, more gas dissolves in it. As a result, when ocean temperatures drop, the CO2 dissolved in the air will be able to return to the water, with a certain delay (to take account of dissolution in deep water)(fig 4)7.
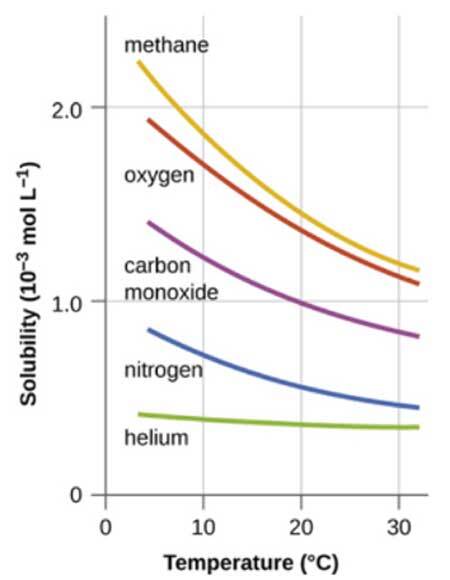 Figure 4: solubility of gases in water decrease as the temperature increases. All solubilities were measured with a constant pressure of 1 atm of gas above the solutions (CC BY; OpenStax).
Milankovitch cycles : Over the last million years, the earth has experienced mainly ice ages
It was then about 6°C cooler than it is today. But what brought us out of glacial periods and into interglacial periods like the one we've been experiencing for the past 12,000 years? Milankovitch cycles, i.e. variations in the Earth's orbit and axis of inclination in relation to the Sun. These cycles explain the temperatures of the last 450,000 years8. There are three parameters, the two most important of which are illustrated here. 5
What would happen if CO2 levels were to rise further ?
Below is a curve showing the emission energy leaving the Earth at high altitude in the IR spectrum (Infrareds, those causing the greenhouse effect) (fig. 5). It shows that a rise from 400 ppm to 800 ppm CO2 would have a limited impact (red vs. black curve in fig 4 below). This curve shows the impact of the absence of CO2 (green curve), or the absence of all triatomic gases including O3 and H2O (vapour only, and we know that liquid H2O (clouds) also has a major impact), on the blue curve showing the absence of any atmosphere. Thus, the increase in CO2 due to fuel combustion from 400 to 800 ppm, which is expected to last about a century, would bring only a small additional energy of 3W/m2 9. The value of 2 W/m2 max for a switch to 900ppm CO2 is even quoted by Daniel Husson10. With a calculated temperature impact of 1.2°C. In one century! The effect of CO2 on this basis is not cause for panic. Remember that in the days of the dinosaurs, CO2 levels fluctuated between 1000 and 2000 ppm. And finally, we won't go into methane at all, which has a lower global impact than CO2, given its very low concentration, and the fact that it degrades (into CO2) within 10 years.
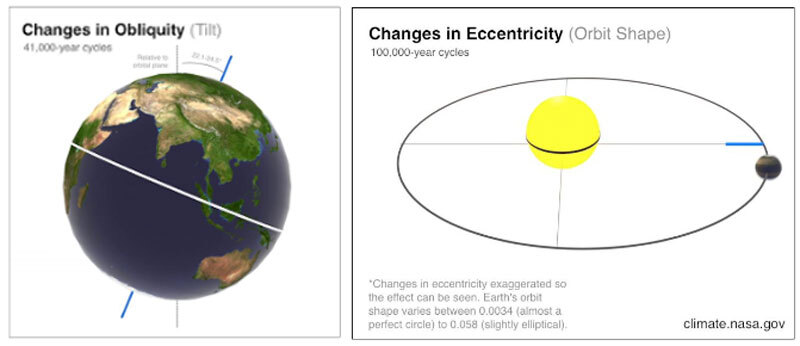
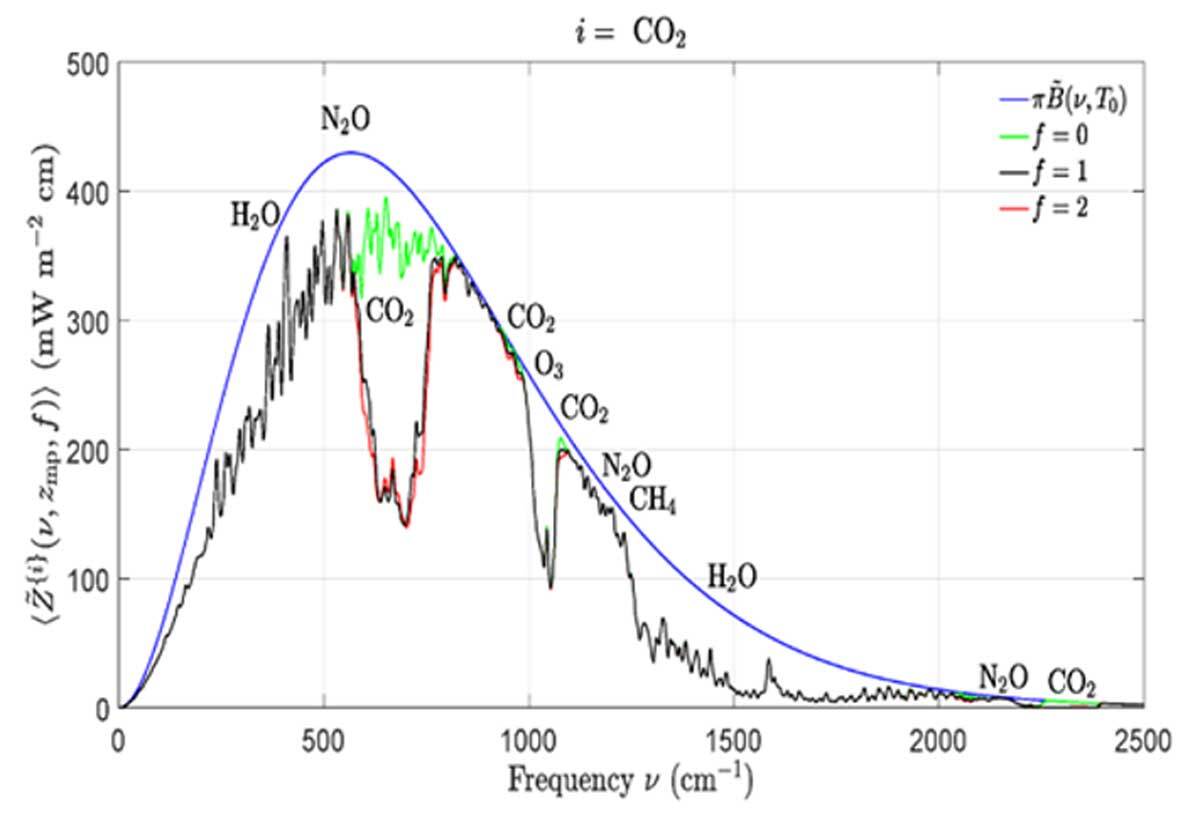
Figure 5: Effects of changing concentration of carbon dioxide, CO2 on the spectral flux at the mesopause altitude (86km). The smooth blue line is the flux from a surface at the earth temperature of 288.7K for an atmosphere without greenhouse gases. The green line is the flux with the CO2 removed but with all the other greenhouse gases (at their standard concentration). The black line is the flux with all the greenhouse gases (at their standard concentration). The red line is the flux for twice the CO2 concentration with all the greenhouse gases at their standard concentration. Doubling the CO2 concentration from 400 to 800 ppm would cause a forcing increase of 3.0 W/m2
Rising temperatures - the causes ?
A study by Nikolov and Zeller11 shows that global warming over the last 24 years (2000 to 2024), observed from satellites (NASA), is 100% explained by the reduction in the earth's reflection (also known as albedo) of 0.7%, which represents 2.7 watts per square metre, and 0% by the reduction in the earth's IR emissions (which would have meant that greenhouse gases were the reason for warming)(fig 6). This reduction in albedo is essentially linked to a drop in cloud cover, and marginally to melting ice. The researchers argue that the IPCC has the wrong conclusion, and that we should be concerned about cloud cover rather than CO2. The origin of cloud reduction is to be found, they argue, in variations in solar winds and terrestrial magnetism. This study goes in the same direction as an older one, which however gives a relative reflection reduction around 20% lower, but over 2001-201712. It should be noted that, based on D. Husson's figures, over the period 2000-2023, CO2 concentration has changed by 40ppm, which should give a CO2-induced temperature rise of 0.1°C, and a thermal anomaly of 0.09W/m2, i.e. low compared with the 2.7 W/m2 quoted here. This is even confirmed by a third study, covering mainly year 202313.
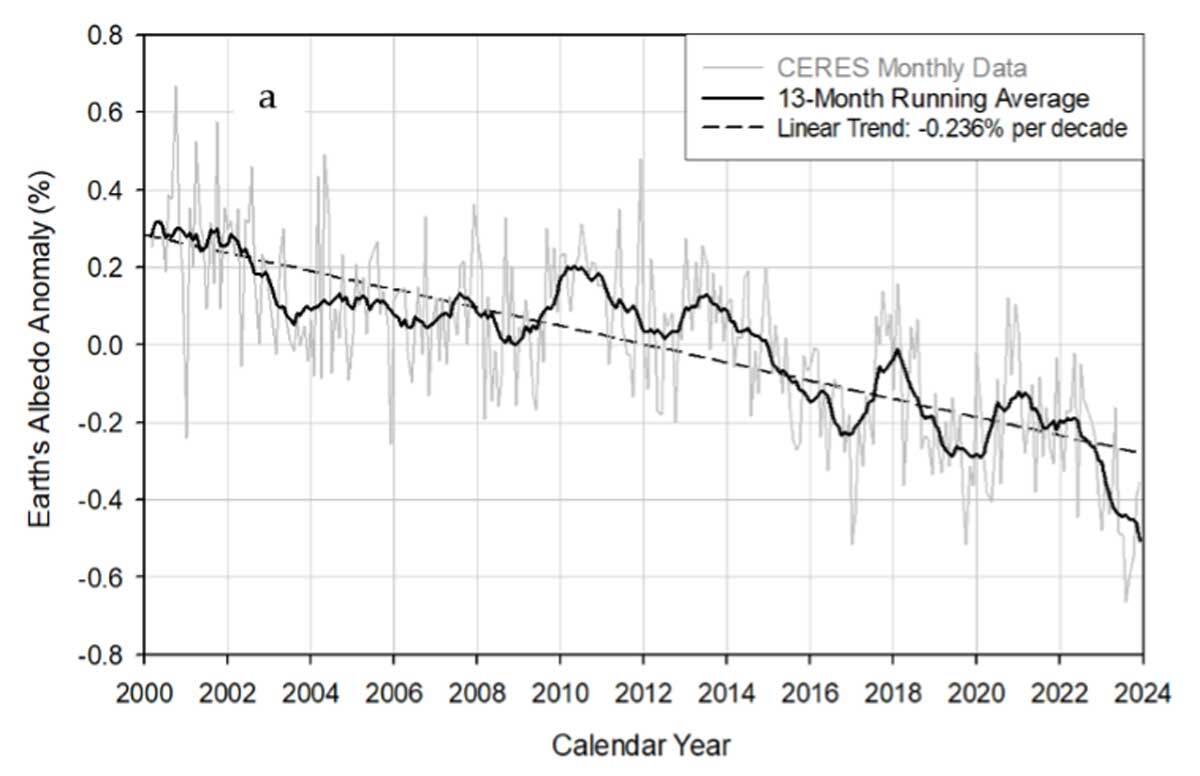
Figure 6 : Monthly radiative anomalies derived from the CERES EBAF 4.2 dataset: (a) Earth's global albedo calculated via dividing the reflected all-sky shortwave anomaly by the globally averaged incident solar flux at the TOA (i.e. the global insolation)
IPCC
But is the IPCC exaggerating the situation? Is CO2 really responsible for global warming? All the demonstrations of CO2 impact cited above are completely ignored by the IPCC13. There's a big difference between the full technical report of several thousand pages, where the science is fairly accurate but often indicates uncertain responsibility for human activities, and the summary for decision-makers (and newspapers), which is blackened14. For example, one of the extracts below from the full technical report (IPCC Ar6, wg1 2001, page 711; fig. 7) shows that the surface area burnt by forest fires has decreased by 20% in 20 years according to satellite observations. This does not seem to correspond to what we read daily in the newspapers...
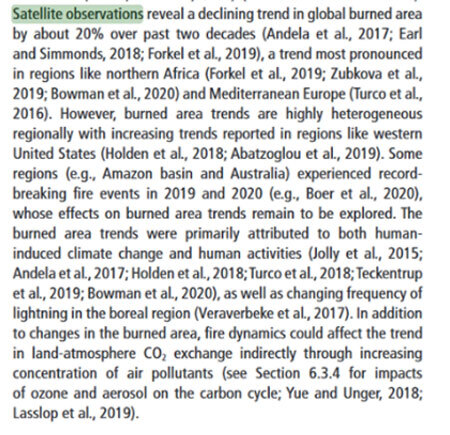 Figure 7: IPCC, page 711 of Ar6, wg1 2021
An Inconvenient Truth
With regard to Al Gore's film, “An Inconvenient Truth”, a judge has only allowed it to be shown in schools on condition that the 9 scientific errors in the film are described15. Al Gore launched an investment fund in 2004, Generation Investment management (LPP), his film “An Inconvenient Truth” was broadcast in 2006, and he now manages CO2 emission funds. Al Gore's voice is neither neutral nor scientific.
Conclusion: what’s next?
As Steve E. Koonin (Obama's science advisor), there is no climate emergency16 ; according to R. Lindzen, a former IPCC expert, journalists talk of cataclysm, not scientists17. As quoted above, Lindzen says that scientists have to keep quiet (...their skepticism), otherwise they lose their funding18. On the other hand, on our planet, there is soil pollution, falling biodiversity and overexploitation of soils and minerals. Consequently, solutions such as electric cars, nuclear power and reinjecting CO2 into the ground, which are “boosted” by exaggerating the impact of CO2, need to be reviewed on the basis of truly scientific criteria. It's important that we don't let ourselves be led either by the electric car and nuclear power lobby, or by the oil lobby. Europe's Green Deal (reduce CO2 emissions at all costs), including through costly mechanisms, puts the whole of Europe in a catastrophic competitive situation. German industries are fleeing Germany because of the high cost of energy (the destruction of North Stream 2, which involved buying American gas at 3 times the price, is a contributing factor). Audi Forest is halting production of electric vehicles (the Audi line was at a standstill for several days following chaotic deliveries of Chinese batteries19 ), and the number of electric car customers is currently falling (Porsche is facing the same wall as Audi: its electric car sales fell by 49.9% in the 1st half-year, to 9,000 vehicles. )20.
- Mark Lynas et al 2021 Environ. Res. Lett. 16 114005
- Ninety-Nine Percent? Re-Examining the Consensus on the Anthropogenic Contribution to Climate Change, Dentelski et alii, 2023
- Willie Soon et alii, 2018, https://doi.org/10.3390/cli11090179
- Richard Lindzen, interview BAM, 2024 https://www.youtube.com/watch?v=F6Rv5P5Qf64, minute 12:40
- Leroy Ladurie, Histoire du climat depuis l’an mil
- https://euanmearns.com/nasa-satellite-climatology-data/
- https://chem.libretexts.org/Bookshelves/Physical_and_Theoretical_Chemistry_Textbook_Maps/Supplemental_Modules_(Physical_and_Theoretical_Chemistry)/Equilibria/Solubilty/Temperature_Effects_on_the_Solubility_of_Gases
- https://science.nasa.gov/science-research/earth-science/milankovitch-orbital-cycles-and-their-role-in-earths-climate/
- Dependence of Earth’s Thermal Radiation on Five Most Abundant Greenhouse Gases, van Wijngaarden & alii, 2020 10 Daniel Husson, Climat, de la confusion à la manipulation, 2024, p.101
- Nikolov, N.; Zeller, K.F. Roles of Earth’s Albedo Variations and Top-of-the-Atmosphere Energy Imbalance in Recent Warming: New Insights from Satellite and Surface Observations. Geomatics 2024, 4, 311–341.
- https://doi.org/10.3390/geomatics4030017
- Earth's Albedo 1998–2017 as Measured From Earthshine, P. R. Goode & alii
- Recent global temperature surge intensified by record-low planetary albedo, F. Goessling, 2024
- Claude Allègre, L’imposture climatique, 2008, p.190
- https://fr.wikipedia.org/wiki/Une_v%C3%A9rit%C3%A9_qui_d%C3%A9range
- S. Koonin, Hoover Institution summer boot camp, 2023 https://youtu.be/acyErLNL7kQ?si=WczRWhNNbzOtGg-y, minute 37.
- Richard Lindzen, 2024 https://www.youtube.com/watch?v=F6Rv5P5Qf64, minute 8:20
- Ibid, minute 12:40
- https://www.lalibre.be/economie/entreprises-startup/2020/02/21/audi-forest-mise-a-larret-plusieurs-jours-faute-dapprovisionnement-de-la-part-de-la-chine-JFSLKUA24NGGPNE5HK6YR3MNH4/
- https://www.lalibre.be/economie/entreprises-startup/2024/07/10/audi-brussels-est-a-la-traine-pour-la-qualite-des-modeles-produits-PSJ3WTSUH5BSFL7QIDXV5W6R7Y/